illumination cameras microscopy / objectives filters / accessories liquid lens / specialty telecentric fixed focal length resource guide
Chromatic Focal Shift (Achromat)
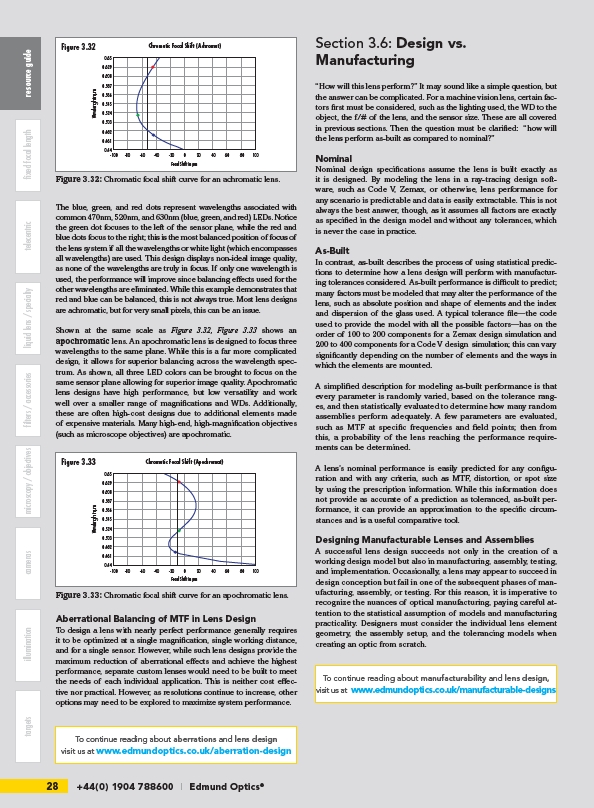
Figure 3.32
Chromatic Focal Shift (Apochromat)
Figure 3.33
28 +44(0) 1904 788600 | Edmund Optics® targets Section 3.6: Design vs.
Manufacturing
“How will this lens perform?” It may sound like a simple question, but
the answer can be complicated. For a machine vision lens, certain factors
first must be considered, such as the lighting used, the WD to the
object, the f/# of the lens, and the sensor size. These are all covered
in previous sections. Then the question must be clarified: “how will
the lens perform as-built as compared to nominal?”
Nominal
Nominal design specifications assume the lens is built exactly as
it is designed. By modeling the lens in a ray-tracing design software,
such as Code V, Zemax, or otherwise, lens performance for
any scenario is predictable and data is easily extractable. This is not
always the best answer, though, as it assumes all factors are exactly
as specified in the design model and without any tolerances, which
is never the case in practice.
As-Built
In contrast, as-built describes the process of using statistical predictions
to determine how a lens design will perform with manufacturing
tolerances considered. As-built performance is difficult to predict;
many factors must be modeled that may alter the performance of the
lens, such as absolute position and shape of elements and the index
and dispersion of the glass used. A typical tolerance file—the code
used to provide the model with all the possible factors—has on the
order of 100 to 200 components for a Zemax design simulation and
200 to 400 components for a Code V design simulation; this can vary
significantly depending on the number of elements and the ways in
which the elements are mounted.
A simplified description for modeling as-built performance is that
every parameter is randomly varied, based on the tolerance ranges,
and then statistically evaluated to determine how many random
assemblies perform adequately. A few parameters are evaluated,
such as MTF at specific frequencies and field points; then from
this, a probability of the lens reaching the performance requirements
can be determined.
A lens’s nominal performance is easily predicted for any configuration
and with any criteria, such as MTF, distortion, or spot size
by using the prescription information. While this information does
not provide as accurate of a prediction as toleranced, as-built performance,
it can provide an approximation to the specific circumstances
and is a useful comparative tool.
Designing Manufacturable Lenses and Assemblies
A successful lens design succeeds not only in the creation of a
working design model but also in manufacturing, assembly, testing,
and implementation. Occasionally, a lens may appear to succeed in
design conception but fail in one of the subsequent phases of manufacturing,
assembly, or testing. For this reason, it is imperative to
recognize the nuances of optical manufacturing, paying careful attention
to the statistical assumption of models and manufacturing
practicality. Designers must consider the individual lens element
geometry, the assembly setup, and the tolerancing models when
creating an optic from scratch.
The blue, green, and red dots represent wavelengths associated with
common 470nm, 520nm, and 630nm (blue, green, and red) LEDs. Notice
the green dot focuses to the left of the sensor plane, while the red and
blue dots focus to the right; this is the most balanced position of focus of
the lens system if all the wavelengths or white light (which encompasses
all wavelengths) are used. This design displays non-ideal image quality,
as none of the wavelengths are truly in focus. If only one wavelength is
used, the performance will improve since balancing effects used for the
other wavelengths are eliminated. While this example demonstrates that
red and blue can be balanced, this is not always true. Most lens designs
are achromatic, but for very small pixels, this can be an issue.
Shown at the same scale as Figure 3.32, Figure 3.33 shows an
apochromatic lens. An apochromatic lens is designed to focus three
wavelengths to the same plane. While this is a far more complicated
design, it allows for superior balancing across the wavelength spectrum.
As shown, all three LED colors can be brought to focus on the
same sensor plane allowing for superior image quality. Apochromatic
lens designs have high performance, but low versatility and work
well over a smaller range of magnifications and WDs. Additionally,
these are often high-cost designs due to additional elements made
of expensive materials. Many high-end, high-magnification objectives
(such as microscope objectives) are apochromatic.
Aberrational Balancing of MTF in Lens Design
To design a lens with nearly perfect performance generally requires
it to be optimized at a single magnification, single working distance,
and for a single sensor. However, while such lens designs provide the
maximum reduction of aberrational effects and achieve the highest
performance, separate custom lenses would need to be built to meet
the needs of each individual application. This is neither cost effective
nor practical. However, as resolutions continue to increase, other
options may need to be explored to maximize system performance.
To continue reading about manufacturability and lens design,
visit us at www.edmundoptics.co.uk/manufacturable-designs
Focal Shift in m
Wavelength in m
0.65
0.629
0.608
0.587
0.566
0.545
0.524
0.503
0.482
0.461
0.44
-100 0 100
-80 -60 -40 -20 20 40 60 80
Figure 3.32: Chromatic focal shift curve for an achromatic lens.
Focal Shift in m
Wavelength in m
0.65
0.629
0.608
0.587
0.566
0.545
0.524
0.503
0.482
0.461
0.44
-100 0 100
-80 -60 -40 -20 20 40 60 80
Figure 3.33: Chromatic focal shift curve for an apochromatic lens.
To continue reading about aberrations and lens design
visit us at www.edmundoptics.co.uk/aberration-design
/manufacturable-designs
/aberration-design