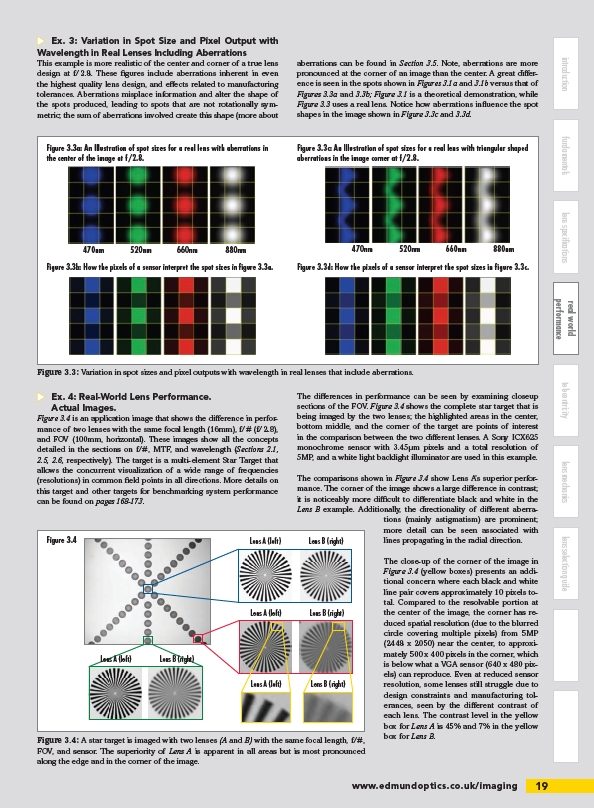
Figure 3.3c: An Illustration of spot sizes for a real lens with triangular shaped
aberrations in the image corner at f/2.8.
470nm 520nm 660nm 880nm 470nm 520nm 660nm 880nm
Figure 3.3d: How the pixels of a sensor interpret the spot sizes in figure 3.3c.
www.edmundoptics.co.uk/imaging 19
introduction fundamentals real world telecentricity lens mechanics lens selection guide
performance lens specifications
u Ex. 3: Variation in Spot Size and Pixel Output with
Wavelength in Real Lenses Including Aberrations
This example is more realistic of the center and corner of a true lens
design at f/2.8. These figures include aberrations inherent in even
the highest quality lens design, and effects related to manufacturing
tolerances. Aberrations misplace information and alter the shape of
the spots produced, leading to spots that are not rotationally symmetric;
the sum of aberrations involved create this shape (more about
aberrations can be found in Section 3.5. Note, aberrations are more
pronounced at the corner of an image than the center. A great difference
is seen in the spots shown in Figures 3.1a and 3.1b versus that of
Figures 3.3a and 3.3b; Figure 3.1 is a theoretical demonstration, while
Figure 3.3 uses a real lens. Notice how aberrations influence the spot
shapes in the image shown in Figure 3.3c and 3.3d.
Figure 3.3a: An Illustration of spot sizes for a real lens with aberrations in
the center of the image at f/2.8.
Figure 3.3b: How the pixels of a sensor interpret the spot sizes in figure 3.3a.
Figure 3.3: Variation in spot sizes and pixel outputs with wavelength in real lenses that include aberrations.
u Ex. 4: Real-World Lens Performance.
Actual Images.
Figure 3.4 is an application image that shows the difference in performance
of two lenses with the same focal length (16mm), f/# (f/2.8),
and FOV (100mm, horizontal). These images show all the concepts
detailed in the sections on f/#, MTF, and wavelength (Sections 2.1,
2.5, 2.6, respectively). The target is a multi-element Star Target that
allows the concurrent visualization of a wide range of frequencies
(resolutions) in common field points in all directions. More details on
this target and other targets for benchmarking system performance
can be found on pages 168-173.
The differences in performance can be seen by examining closeup
sections of the FOV. Figure 3.4 shows the complete star target that is
being imaged by the two lenses; the highlighted areas in the center,
bottom middle, and the corner of the target are points of interest
in the comparison between the two different lenses. A Sony ICX625
monochrome sensor with 3.45μm pixels and a total resolution of
5MP, and a white light backlight illuminator are used in this example.
The comparisons shown in Figure 3.4 show Lens A’s superior performance.
The corner of the image shows a large difference in contrast;
it is noticeably more difficult to differentiate black and white in the
Lens B example. Additionally, the directionality of different aberrations
(mainly astigmatism) are prominent;
more detail can be seen associated with
lines propagating in the radial direction.
The close-up of the corner of the image in
Figure 3.4 (yellow boxes) presents an additional
concern where each black and white
line pair covers approximately 10 pixels total.
Compared to the resolvable portion at
the center of the image, the corner has reduced
spatial resolution (due to the blurred
circle covering multiple pixels) from 5MP
(2448 x 2050) near the center, to approximately
500 x 400 pixels in the corner, which
is below what a VGA sensor (640 x 480 pixels)
can reproduce. Even at reduced sensor
resolution, some lenses still struggle due to
design constraints and manufacturing tolerances,
seen by the different contrast of
each lens. The contrast level in the yellow
box for Lens A is 45% and 7% in the yellow
Figure 3.4 Lens A (left) Lens B (right)
Lens A (left) Lens B (right)
Lens A (left) Lens B (right)
Lens A (left) Lens B (right)
Figure 3.4: A star target is imaged with two lenses (A and B) with the same focal length, f/#, box for Lens B.
FOV, and sensor. The superiority of Lens A is apparent in all areas but is most pronounced
along the edge and in the corner of the image.
/imaging