The Diffraction Limit and f/#
IMAGING LENS
www.edmundoptics.co.uk/imaging 13
introduction fundamentals lens specifications real world performance telecentricity lens mechanics lens selection guide
Contrast Limitations for Lenses
Lens contrast is defi ned as the percentage of contrast on the object
that is reproduced into image space when assuming no contrast loss
on the object from illumination. Resolution is meaningless unless
defi ned at a specifi c contrast. In Section 2.2, the example assumed
perfect reproduction on the object, including sharp transitions at the
edge of the object on the pixel. However, this is never the case in
practice. Because of the nature of light, even a perfectly designed and
manufactured lens cannot fully reproduce an object’s resolution and
contrast. For example, as shown in Figure 2.4, even when the lens is
operating at the diff raction limit (described in Section 2.4), the edges
of the dots will be blurred in the image. This is where calculating a
system’s resolution by simply counting pixels loses accuracy and can
even become completely ineff ective.
Consider again the two dots close to each other being imaged through
a lens, as in Figure 2.4. When the spots are far apart (at a low frequency),
the dots are distinct, though somewhat blurry at the edges.
As they approach each other (representing an increase in resolution),
the blurs overlap until the dots can no longer be distinguished separately.
The system’s actual resolving power depends on the imaging
system’s ability to detect the space between the dots. Even if there
are ample pixels between the spots, if the spots blend together due to
lack of contrast, they will not easily be resolved as two separate details.
Therefore, the resolution of the system depends on many things,
including blur caused by diff raction and other optical errors, object
detail spacing, and the sensor’s ability to detect contrast at the detail
size of interest.
Figure 2.4
Contrast and Frequency
OBJECT IMAGE
IMAGING LENS
Iris
Figure 2.4: Two spots imaged by the same lens. The top lens is imaging
objects at a low frequency; the bottom lens is imaging objects at
a higher frequency.
The Airy Disk
When light passes through any size aperture (every lens has a fi nite
aperture), diff raction occurs. The resulting diff raction pattern, a bright
region in the center, together with a series of concentric rings of decreasing
intensity around it, is called the Airy disk (see Figure 2.5).
The diameter of this pattern is related to the wavelength (λ) of the
illuminating light and the size of the circular aperture, which is important
since the Airy disk is the smallest point to which a beam of
light can be focused. As focused Airy patterns from diff erent object
details approach one another, they begin to overlap (see Section 2.3
on contrast). When the overlapping patterns create enough constructive
interference to reduce contrast, as in Figure 2.4, they eventually
become indistinguishable from each other. Figure 2.5 shows the difference
in spot sizes between a lens set at f/2.8 and a lens set at f/8.
This eff ect becomes more of an issue as pixels continue to reduce in
size. The Airy disk (ØAiry Disk), or minimum spot size, can be estimated
using the f/# and wavelength (λ):
Table 2.5 shows the Airy disk diameter for diff erent f/#s using green
light (520nm). The smallest achievable spot size can quickly exceed
the size of small pixels. This leads to diffi culties in yielding the full
resolution capacities of a sensor with any usable level of contrast.
Additionally, this does not consider any lens design limitations or
manufacturing errors associated with the fabrication of lens elements
or the optical assemblies, which can lead to reductions in the ability
to produce the smallest physically achievable spot and thus reduce
levels of resolution and contrast. Note: This is all theoretical and is
the starting point for limitations in an optical system.
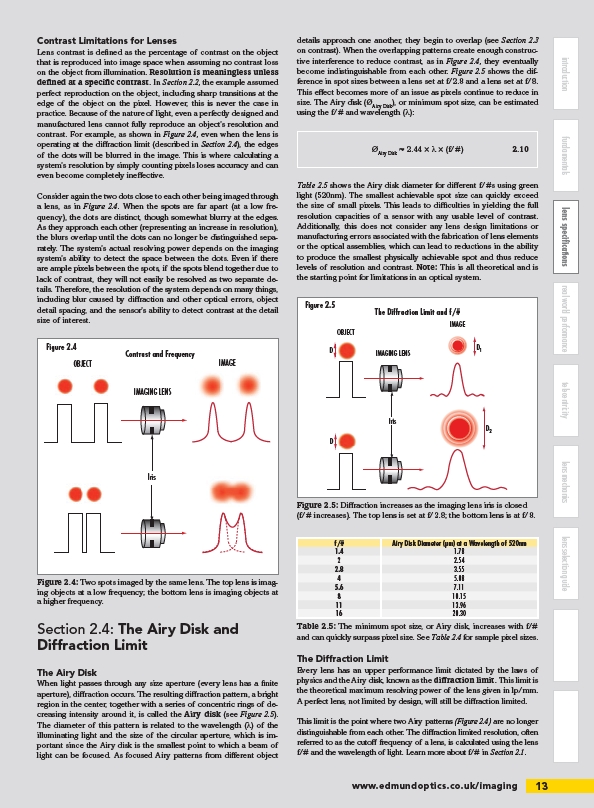
Figure 2.5
The Diffraction Limit
Every lens has an upper performance limit dictated by the laws of
physics and the Airy disk, known as the diff raction limit. This limit is
the theoretical maximum resolving power of the lens given in lp/mm.
A perfect lens, not limited by design, will still be diff raction limited.
This limit is the point where two Airy patterns (Figure 2.4) are no longer
distinguishable from each other. The diff raction limited resolution, often
referred to as the cutoff frequency of a lens, is calculated using the lens
f/# and the wavelength of light. Learn more about f/# in Section 2.1.
Section 2.4: The Airy Disk and
Diffraction Limit
ØAiry Disk ≈ 2.44 × λ × (f/#) 2.10
OBJECT
IMAGE
D
D
D1
D2
Iris
Figure 2.5: Diff raction increases as the imaging lens iris is closed
(f/# increases). The top lens is set at f/2.8; the bottom lens is at f/8.
f/# Airy Disk Diameter (μm) at a Wavelength of 520nm
1.4 1.78
2 2.54
2.8 3.55
4 5.08
5.6 7.11
8 10.15
11 13.96
16 20.30
Table 2.5: The minimum spot size, or Airy disk, increases with f/#
and can quickly surpass pixel size. See Table 2.4 for sample pixel sizes.
/imaging