Figure 3.22 Sensor Tilt and Depth of Focus
Definitions:
α: Sensor Tilt
z: Axial Shift due to “α”
s: Pixel Size
p: Number of Pixels on sensor
h: Half Sensor Size
: Depth of Focus
(f/#)w: Working F-number
= 2 × (f/#)w × s
z = s × p × tan(α)
12
2
> z
(f/#)w> (p*tan(α))/2
h
z
α
Sensor
Lens
Pixel
(f/#)w
s
f/2.8
Corner
Center
Diff. Limit
75
Best Focus on axis.
No sensor Tilt
0 150
Spatial Frequency in Cycles per mm
f/5.6
Corner
Center
Diff. Limit
75
Best Focus on axis.
No sesnsor tilt
0 150
Spatial Frequency in Cycles per mm
www.edmundoptics.eu/imaging 25
introduction fundamentals real world telecentricity lens mechanics lens selection guide
performance lens specifications
2.6. Note that this diffraction effect is not viewable in Figure 3.19, but
that it is mentioned here as something to mind.
In general, when lenses are focused at short WDs, the large cone
angles cause the cones to diverge very quickly on either side of best
focus, leading to limited DOF. For objects in focus at longer WDs, the
transition rate of the bundles decreases and DOF will increase.
u Ex: f/# Effects Close Up at the Object Level
Figure 3.20a illustrates the ray bundle at the center of an object under
inspection at f/2,8 (a) and f/8 (b). The vertical lines represent 2mm
increments away from best focus. On each vertical line, a square represents
the discrete feature size of single pixel of detail. Figure 3.20a
shows that as the width of the ray bundle spreads out, more rays miss
the detail. In Figure 3.20b, the bundle expands more slowly and the
rays all strike the detail which is larger than the bundle diameter for
all depths shown. Figure 3.21 shows the same concept as Figure 3.20,
but the cones represent multiple points in the FOV. Each detail and
subsequent space represent one line pair. The overlap in the bundles
in Figure 3.21a shows how the information blends together faster than
that of Figure 3.20b and shows how two different object details can
blur together due to a lower f/#. In Figure 3.21b, this does not occur
due to the higher f/# of the lens.
Depth of Focus
Depth of focus is the image-space complement of DOF and is related
to how the quality of focus changes on the sensor side of the lens
as the sensor is moved, while the object remains in the same position.
Depth of focus characterizes how much tip and tilt is tolerated
between the lens image plane and the sensor plane itself. As f/# decreases,
the depth of focus does as well, which increases the impact
that tilt has on achieving best focus across the sensor.
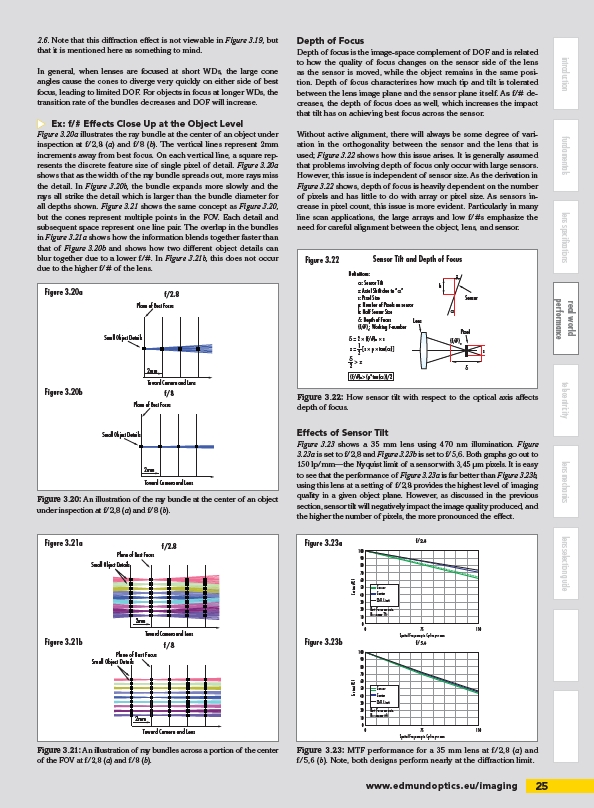
Without active alignment, there will always be some degree of variation
in the orthogonality between the sensor and the lens that is
used; Figure 3.22 shows how this issue arises. It is generally assumed
that problems involving depth of focus only occur with large sensors.
However, this issue is independent of sensor size. As the derivation in
Figure 3.22 shows, depth of focus is heavily dependent on the number
of pixels and has little to do with array or pixel size. As sensors increase
in pixel count, this issue is more evident. Particularly in many
line scan applications, the large arrays and low f/#s emphasize the
need for careful alignment between the object, lens, and sensor.
Effects of Sensor Tilt
Figure 3.23 shows a 35 mm lens using 470 nm illumination. Figure
3.23a is set to f/2,8 and Figure 3.23b is set to f/5,6. Both graphs go out to
150 lp/mm—the Nyquist limit of a sensor with 3,45 μm pixels. It is easy
to see that the performance of Figure 3.23a is far better than Figure 3.23b,
using this lens at a setting of f/2,8 provides the highest level of imaging
quality in a given object plane. However, as discussed in the previous
section, sensor tilt will negatively impact the image quality produced, and
the higher the number of pixels, the more pronounced the effect.
Figure 3.20a
f/2.8
Plane of Best Focus
2mm
Toward Camera and Lens
f/8
Small Object Details
Plane of Best Focus
Small Object Details
2mm
Toward Camera and Lens
Figure 3.20b
Figure 3.20: An illustration of the ray bundle at the center of an object
under inspection at f/2,8 (a) and f/8 (b).
Figure 3.21a
Plane of Best Focus
2mm
f/2.8
Toward Camera and Lens
Small Object Details
Plane of Best Focus
Small Object Details
2mm
f/8
Toward Camera and Lens
Figure 3.21b
Figure 3.21: An illustration of ray bundles across a portion of the center
of the FOV at f/2,8 (a) and f/8 (b).
Figure 3.22: How sensor tilt with respect to the optical axis affects
depth of focus.
Figure 3.23a
Contrast (%)
100
90
80
70
60
50
40
30
20
10
0
Figure 3.23b
Contrast (%)
100
90
80
70
60
50
40
30
20
10
0
Figure 3.23: MTF performance for a 35 mm lens at f/2,8 (a) and
f/5,6 (b). Note, both designs perform nearly at the diffraction limit.
/imaging