illumination cameras microscopy / objectives filters / accessories liquid lens / specialty telecentric fixed focal length resource guide
Section 3.2: Relative Illumination, Figure 3.5a f/# of lens
Roll-Off, and Vignetting
20 +44 (0) 1904 788600 | Edmund Optics® targets 100
90
80
70
60
50
40
30
20
10
0
Illumination (%)
Relative Illumination
f/1.4
f/2.8
f/4.0
f/5.6
Sensor Format: ¼” ” ½” ”
0.00 2.75 5.50
Image Height (mm)
typical sensor heights
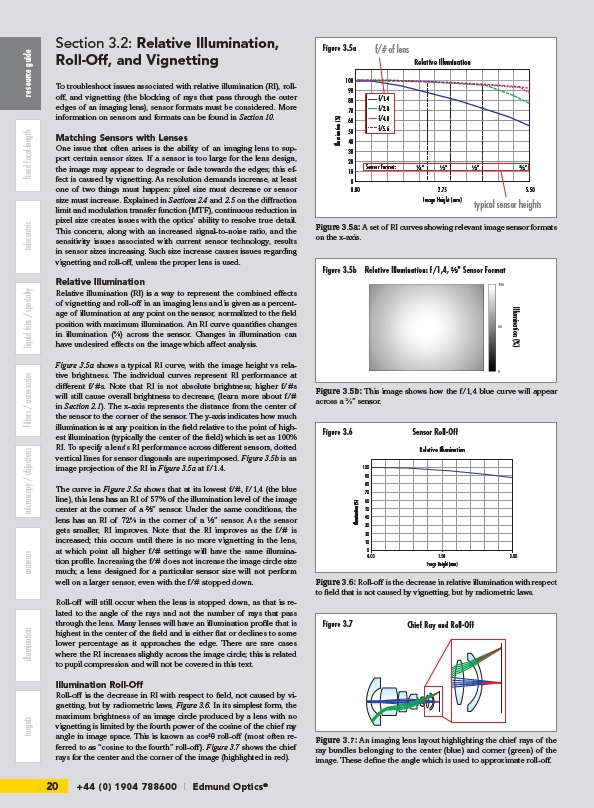
Figure 3.5a: A set of RI curves showing relevant image sensor formats
on the x-axis.
Illumination (%)
Figure 3.5b Relative Illumination: f/1,4, 2/3" Sensor Format
Figure 3.5b: This image shows how the f/1,4 blue curve will appear
across a 2/3” sensor.
To troubleshoot issues associated with relative illumination (RI), rolloff,
and vignetting (the blocking of rays that pass through the outer
edges of an imaging lens), sensor formats must be considered. More
information on sensors and formats can be found in Section 10.
Matching Sensors with Lenses
One issue that often arises is the ability of an imaging lens to support
certain sensor sizes. If a sensor is too large for the lens design,
the image may appear to degrade or fade towards the edges; this effect
is caused by vignetting. As resolution demands increase, at least
one of two things must happen: pixel size must decrease or sensor
size must increase. Explained in Sections 2.4 and 2.5 on the diffraction
limit and modulation transfer function (MTF), continuous reduction in
pixel size creates issues with the optics’ ability to resolve true detail.
This concern, along with an increased signal-to-noise ratio, and the
sensitivity issues associated with current sensor technology, results
in sensor sizes increasing. Such size increase causes issues regarding
vignetting and roll-off, unless the proper lens is used.
Relative Illumination
Relative illumination (RI) is a way to represent the combined effects
of vignetting and roll-off in an imaging lens and is given as a percentage
of illumination at any point on the sensor, normalized to the field
position with maximum illumination. An RI curve quantifies changes
in illumination (%) across the sensor. Changes in illumination can
have undesired effects on the image which affect analysis.
Figure 3.5a shows a typical RI curve, with the image height vs relative
brightness. The individual curves represent RI performance at
different f/#s. Note that RI is not absolute brightness; higher f/#s
will still cause overall brightness to decrease, (learn more about f/#
in Section 2.1). The x-axis represents the distance from the center of
the sensor to the corner of the sensor. The y-axis indicates how much
illumination is at any position in the field relative to the point of highest
illumination (typically the center of the field) which is set as 100%
RI. To specify a lens's RI performance across different sensors, dotted
vertical lines for sensor diagonals are superimposed. Figure 3.5b is an
image projection of the RI in Figure 3.5a at f/1.4.
The curve in Figure 3.5a shows that at its lowest f/#, f/1,4 (the blue
line), this lens has an RI of 57% of the illumination level of the image
center at the corner of a 2/3” sensor. Under the same conditions, the
lens has an RI of 72% in the corner of a 1/2” sensor. As the sensor
gets smaller, RI improves. Note that the RI improves as the f/# is
increased; this occurs until there is no more vignetting in the lens,
at which point all higher f/# settings will have the same illumination
profile. Increasing the f/# does not increase the image circle size
much; a lens designed for a particular sensor size will not perform
well on a larger sensor, even with the f/# stopped down.
Roll-off will still occur when the lens is stopped down, as that is related
to the angle of the rays and not the number of rays that pass
through the lens. Many lenses will have an illumination profile that is
highest in the center of the field and is either flat or declines to some
lower percentage as it approaches the edge. There are rare cases
where the RI increases slightly across the image circle; this is related
to pupil compression and will not be covered in this text.
Illumination Roll-Off
Roll-off is the decrease in RI with respect to field, not caused by vignetting,
but by radiometric laws, Figure 3.6. In its simplest form, the
maximum brightness of an image circle produced by a lens with no
vignetting is limited by the fourth power of the cosine of the chief ray
angle in image space. This is known as cos4θ roll-off (most often referred
to as “cosine to the fourth” roll-off). Figure 3.7 shows the chief
rays for the center and the corner of the image (highlighted in red).
Figure 3.6 Sensor Roll-Off
Illumination (%) Relative Illumination
100
90
80
70
60
50
40
30
20
10
0
0.00 1.50 3.00
Image Height (mm)
Figure 3.6: Roll-off is the decrease in relative illumination with respect
to field that is not caused by vignetting, but by radiometric laws.
Figure 3.7 Chief Ray and Roll-Off
Figure 3.7: An imaging lens layout highlighting the chief rays of the
ray bundles belonging to the center (blue) and corner (green) of the
image. These define the angle which is used to approximate roll-off.