illumination cameras microscopy / objectives filters / accessories liquid lens / specialty telecentric fixed focal length resource guide
Section 3: Real World Performance
Section 3.1: Sensor Performance
and Limitations
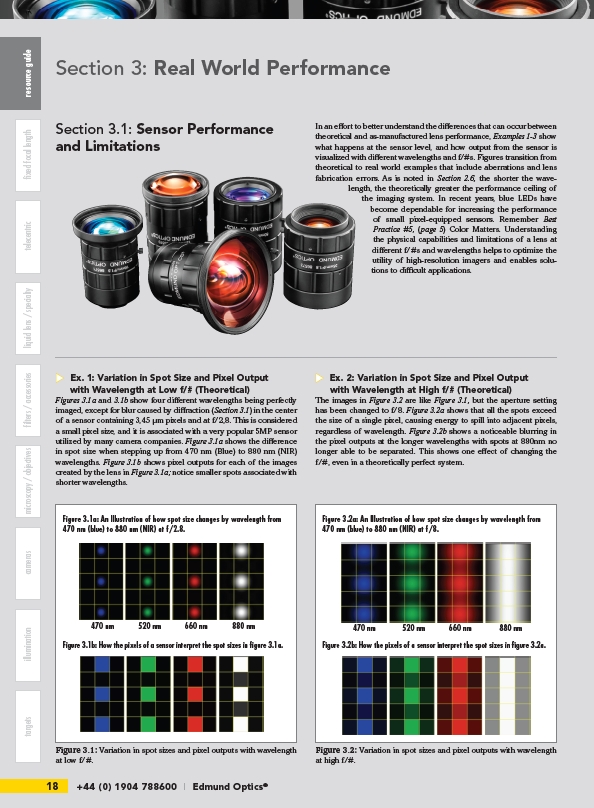
Figure 3.1a: An Illustration of how spot size changes by wavelength from
470 nm (blue) to 880 nm (NIR) at f/2.8.
470 nm 520 nm 660 nm 880 nm 470 nm 520 nm 660 nm 880 nm
Figure 3.1b: How the pixels of a sensor interpret the spot sizes in fi gure 3.1a.
18 +44 (0) 1904 788600 | Edmund Optics® targets In an eff ort to better understand the diff erences that can occur between
theoretical and as-manufactured lens performance, Examples 1-3 show
what happens at the sensor level, and how output from the sensor is
visualized with diff erent wavelengths and f/#s. Figures transition from
theoretical to real world examples that include aberrations and lens
fabrication errors. As is noted in Section 2.6, the shorter the wavelength,
the theoretically greater the performance ceiling of
the imaging system. In recent years, blue LEDs have
become dependable for increasing the performance
of small pixel-equipped sensors. Remember Best
Practice #5, (page 5) Color Matters. Understanding
the physical capabilities and limitations of a lens at
diff erent f/#s and wavelengths helps to optimize the
utility of high-resolution imagers and enables solutions
to diffi cult applications.
u Ex. 1: Variation in Spot Size and Pixel Output
with Wavelength at Low f/# (Theoretical)
Figures 3.1a and 3.1b show four diff erent wavelengths being perfectly
imaged, except for blur caused by diff raction (Section 3.1) in the center
of a sensor containing 3,45 μm pixels and at f/2,8. This is considered
a small pixel size, and it is associated with a very popular 5MP sensor
utilized by many camera companies. Figure 3.1a shows the diff erence
in spot size when stepping up from 470 nm (Blue) to 880 nm (NIR)
wavelengths. Figure 3.1b shows pixel outputs for each of the images
created by the lens in Figure 3.1a; notice smaller spots associated with
shorter wavelengths.
u Ex. 2: Variation in Spot Size and Pixel Output
with Wavelength at High f/# (Theoretical)
The images in Figure 3.2 are like Figure 3.1, but the aperture setting
has been changed to f/8. Figure 3.2a shows that all the spots exceed
the size of a single pixel, causing energy to spill into adjacent pixels,
regardless of wavelength. Figure 3.2b shows a noticeable blurring in
the pixel outputs at the longer wavelengths with spots at 880nm no
longer able to be separated. This shows one eff ect of changing the
f/#, even in a theoretically perfect system.
Figure 3.1: Variation in spot sizes and pixel outputs with wavelength
at low f/#.
Figure 3.2a: An Illustration of how spot size changes by wavelength from
470 nm (blue) to 880 nm (NIR) at f/8.
Figure 3.2b: How the pixels of a sensor interpret the spot sizes in fi gure 3.2a.
Figure 3.2: Variation in spot sizes and pixel outputs with wavelength
at high f/#.